LogicNets applications navigate your modeled pathways as the user interacts with them. The system captures every data point along the way. As a result, the system can deliver powerful reporting and analysis about how guidance provided by your applications impacts the business. This information markedly increases the organization’s expertise and enables AI processes for machine learning and predictive analytics.
Package Reporting
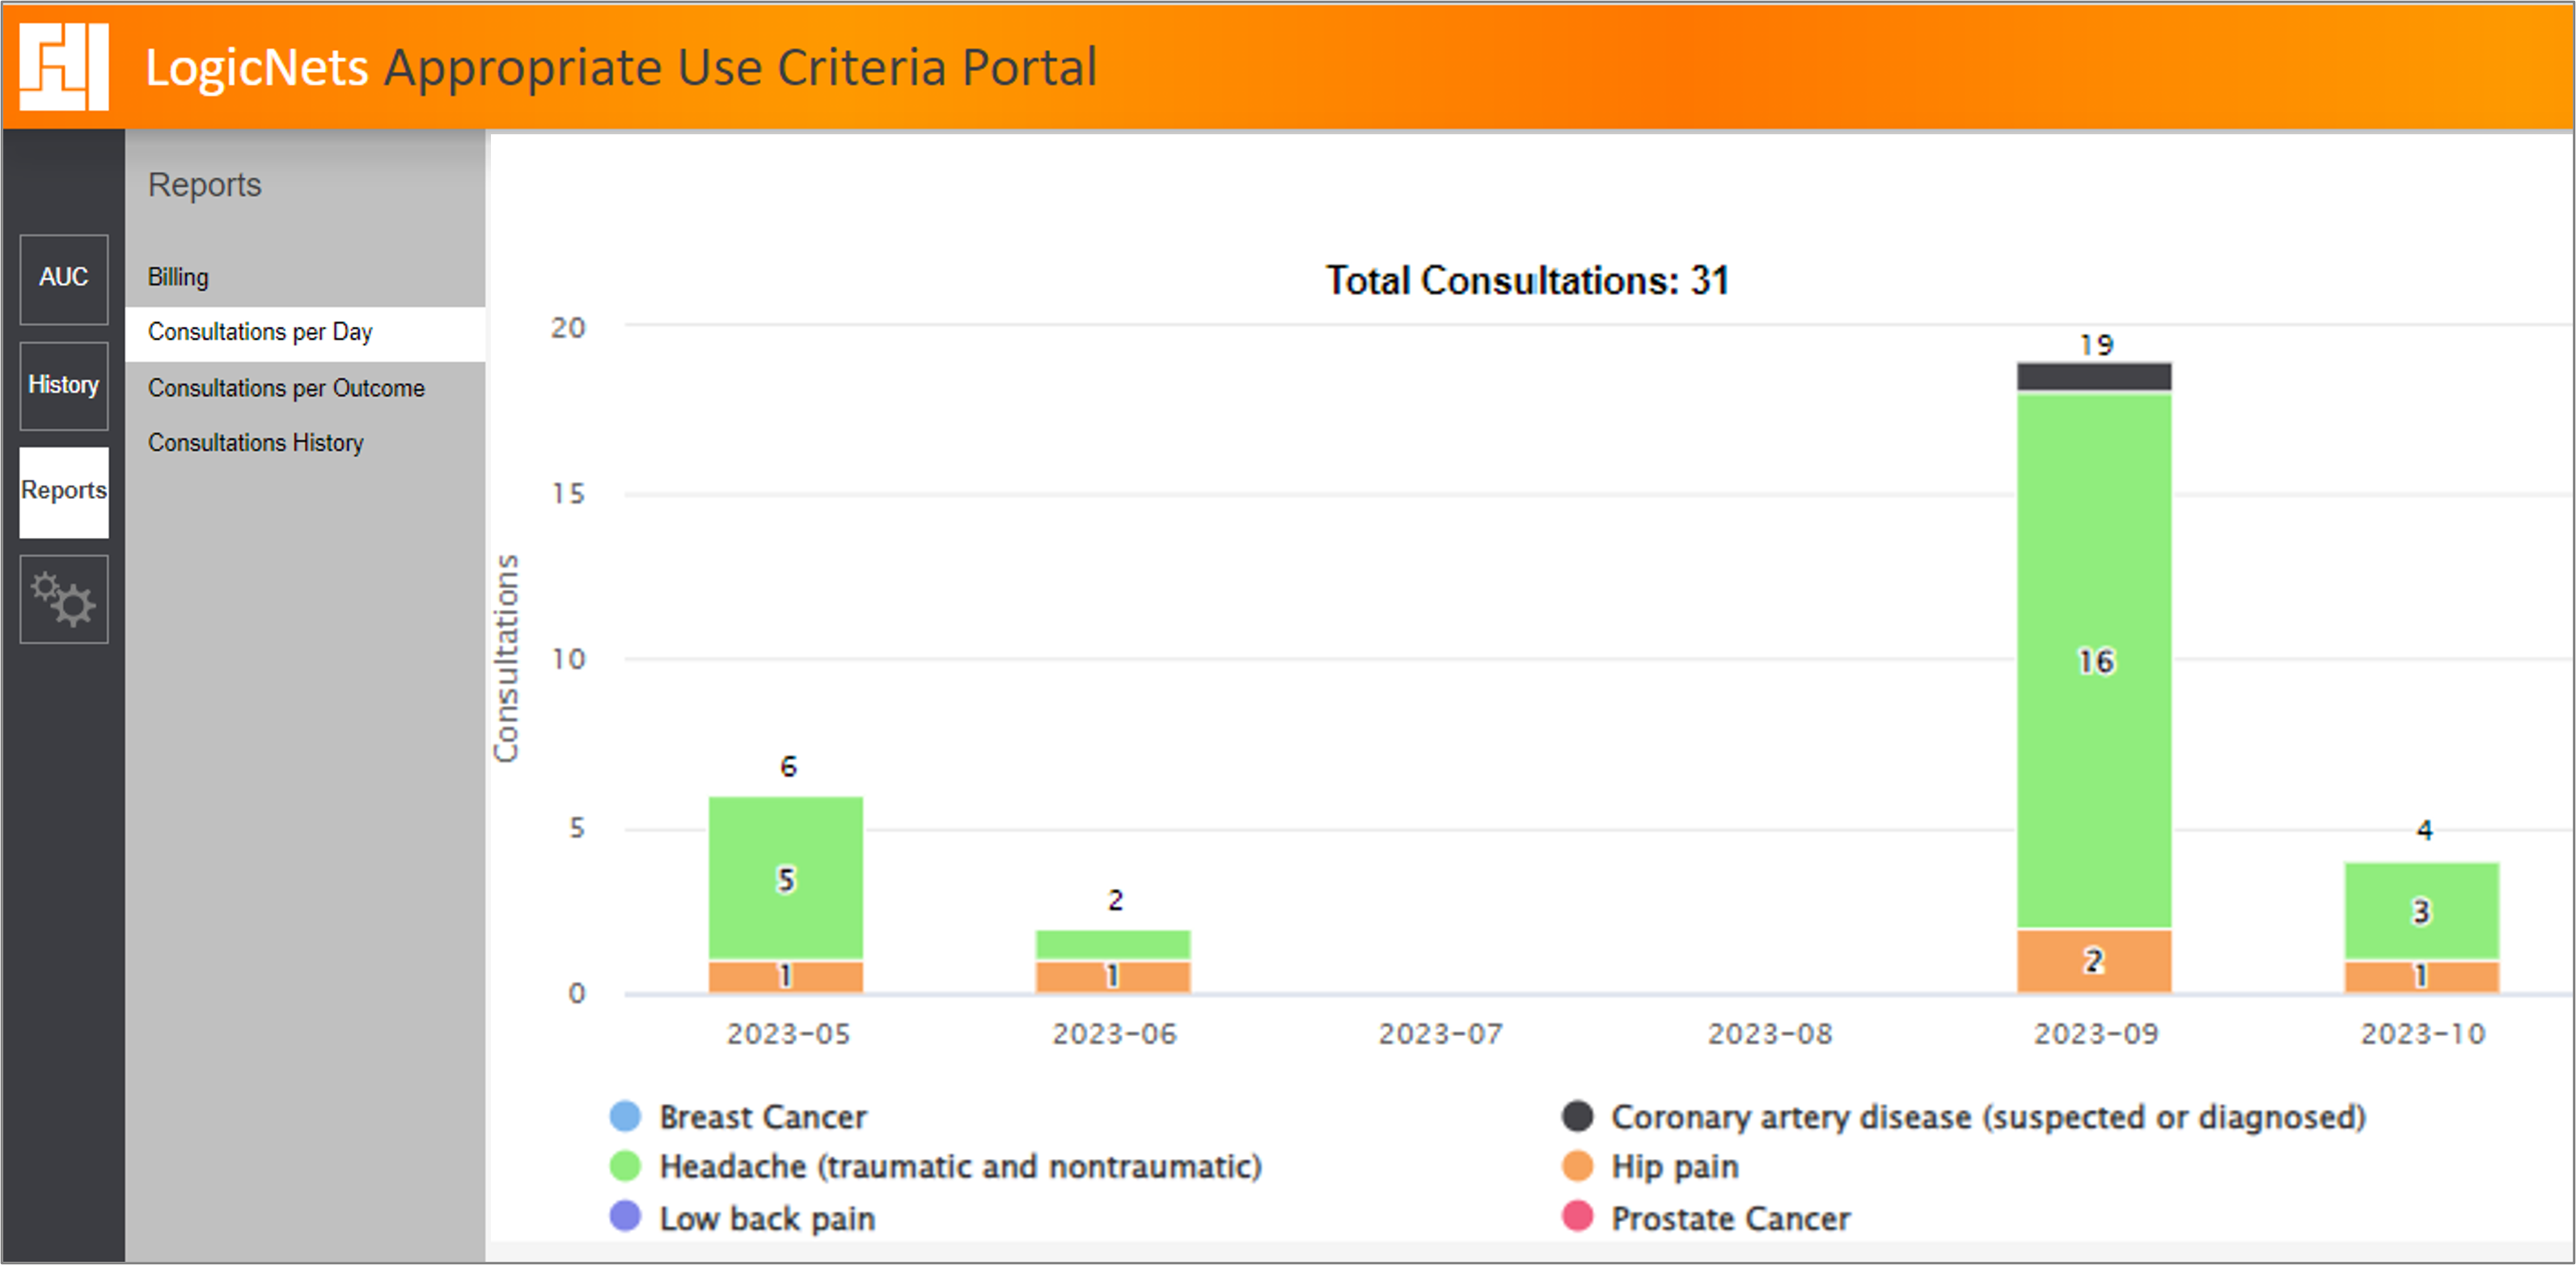
With LogicNets reporting, your organization can monitor key usage metrics and have clear insight into how your LogicNets applications are being used. The system generates standard reports for each published application telling you:
How often your applications are being used
Which users or groups of users are active on the system
How your application models and underlying content are being used
Analytics
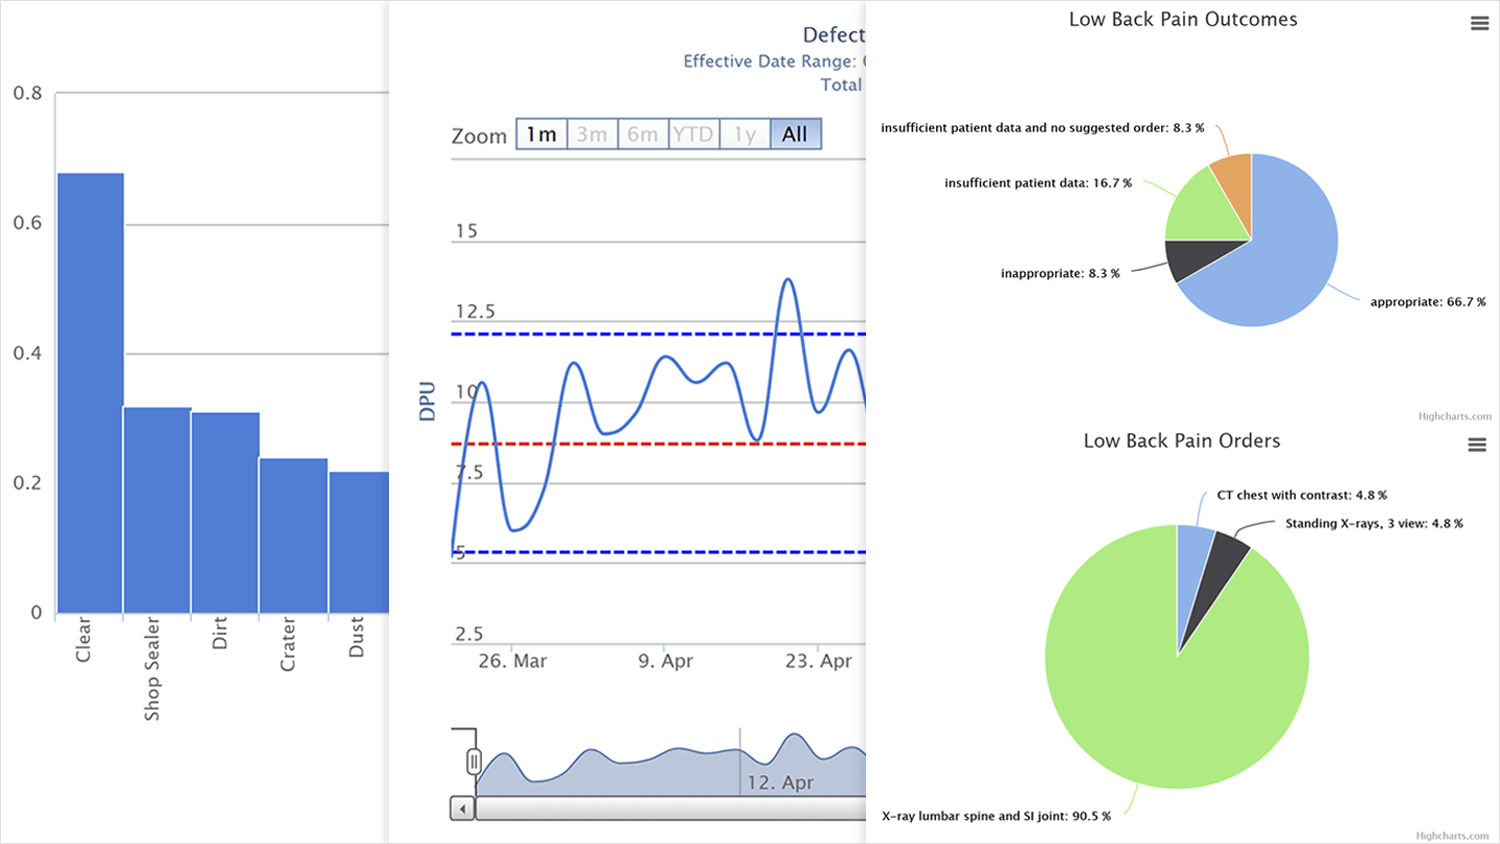
You can model your own custom reports in the LogicNets designer, drawing on the data that is collected in your applications to perform powerful analytics. Our data store retains histories of all runs and user interactions. You can query this data and graphically represent it using the advanced charting software integrated into our system. Your analyses can be presented and shared in a range of formats:
Charting (enabled by HighCharts graphical reporting)
Tabular data displays (with built-in download options)
Visual dashboards
Built-in PDF generation
Built-in email distribution
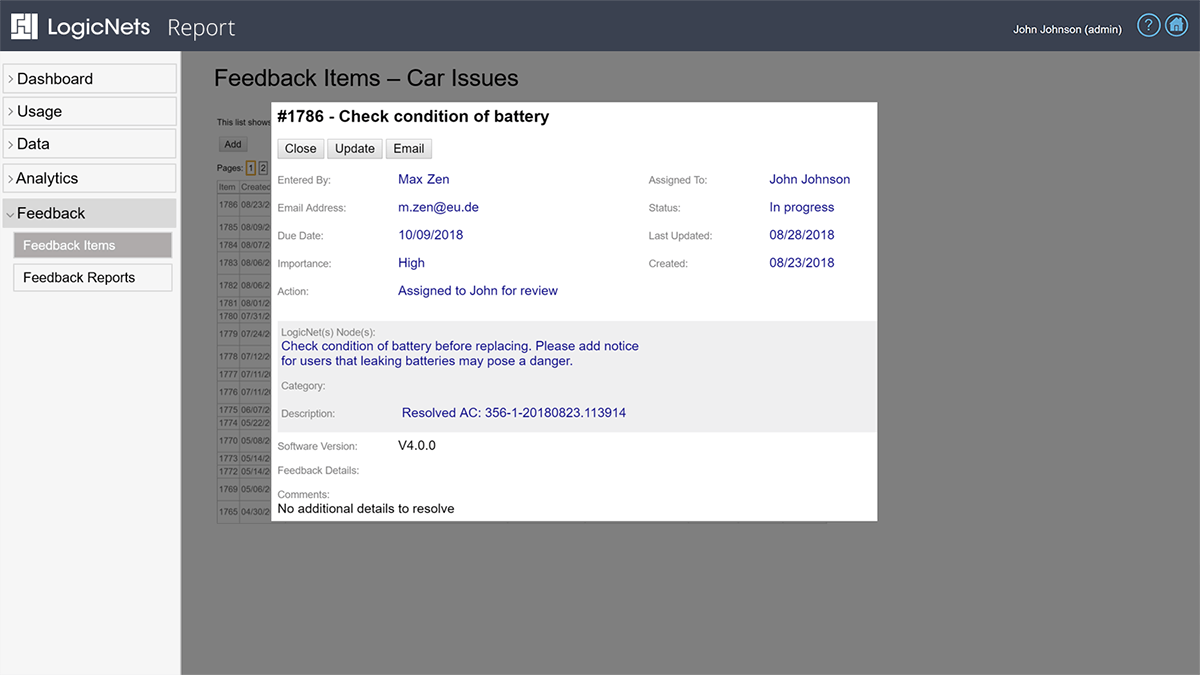
Feedback
Crowd-sourcing is the proven technique for perfecting and maintaining sophisticated applications. Your end users can use the feedback option to directly provide input on any of your deployed applications. This dialogue can be maintained over time and can tie in multiple users. Feedback automatically captures the context, data state, and screen captures at the time the user submits their input so that you fully understand the experience prompting their comments.